
In an age where data seems to dictate many aspects of our culture, it is nice to see the artful interpretations of Alisa Singer, who transforms quantitative scientific analysis on climate change into colorful and expressive works of art.
Previously, I discussed the work of Nancy Graves, who blurred the line between abstract and representational paintings with her series of works that commented on satellite imagery and mapping technology. Graves’ imagery showed the ways that maps can be a form of both objective and subjective information.
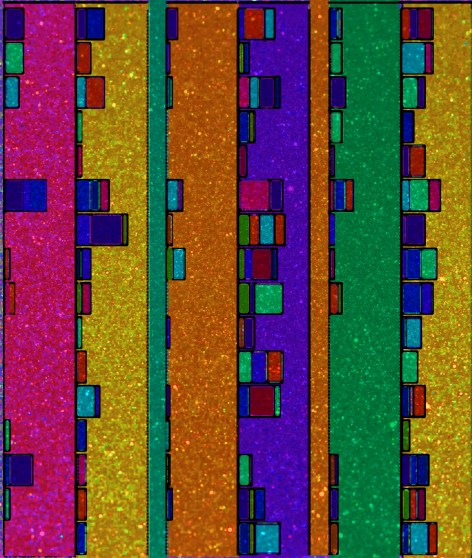
Like Graves, Alisa Singer utilizes the evocative nature of art in order to bring awareness to the way civilizations rely heavily on data and infographics, while not always forming a personal and meaningful relationship to the information. Big data is daunting, and unless you have a background studying it, charts and graphs feel largely removed from the lived experience. In her series of digital paintings called Environmental Graphiti, Singer analyzes charts and graphs from world climate reports, in order to re-present them in a way that stirs emotional responses and aims to get viewers to make deeper connections to climate change. The title of the series incorporates a playful rewording of the art style graffiti to describe the fusion of quantitative data and emotive art. It is an apt name for Singer’s contemporary and hip artworks that resemble the aesthetic and conceptual nature of painterly public art, while spreading scientific awareness.
The elements of art such as color, line and shape have symbolic properties that communicate and make associations to mood, memory and archetypal signifiers. In Singer’s work, these elements are incorporated along with principals of design such as balance, unity and contrast, in order to create compositions that effectively symbolize causes, effects and actions related to addressing climate change.

The Environmental Graphiti paintings are categorized into three identifying topics:
- WHY is our climate changing? → Gallery A
- HOW is climate change affecting our world? → Gallery B
- WHO is at risk? → Gallery C
- WHAT can we do to address climate change? → Gallery
One example of the ‘WHY’ is Emissions Levels Determine Temperature Rise, a semi-abstract digital painting inspired by a graph from the Third National Climate Assessment, Climate Change Impacts in the United States, USGCRP (2014). Singer uses warm and cool colors in a manner that symbolizes the temperature changes due to greenhouse gas emissions. In ‘HOW,’ paintings like Wildfires expressively portray how climate change is affecting natural disasters by changing the conditions of soil and moisture. The result is an increase in drier conditions that provide ample kindling for devastating wildfires.


‘WHO’ is at risk? Every living being on the planet is affected due to a myriad of factors such as disease, caused by rising temperatures, displacement of water sources caused by agriculture and industry. The painting Vector-Borne Diseases resembles the form of a mosquito filled in with a palette of vibrant colors, gesturally blended together. The mosquito is actually composed of text (see sketch above) related to vector-borne diseases such as Dengue Fever, Malaria and Zika. The enduring question of ‘WHAT’ we can do to address climate change, is presented through works such as Climate Change Mitigation and U.N. Sustainability Goals. In this digital artwork, Singer illuminates the United Nation’s Sustainable Development Goals (SDGs), which was adopted in 2015. The original chart that the painting was based on, shows the correlation between sustainable development that protects the environment, and social development such as poverty eradication and reducing inequalities. The painting translates the U.N.’s graph into glittering bands of color, as if to symbolize the hope and perseverance for reversing negative cultural and environmental trends.
Singer’s combination of art and science helps make data more appealing and compelling because it transforms big data into a visual narrative that can be described, analyzed and valued using both concrete and abstract thought. We are able to assign feelings to the quantitative information due to the elements of art and design at play in these compositions. This adds a component of compassion and enables us to make connections between statistics and our daily life experiences.
While data is a great way for scientists and policy makers to organize and keep track of their research and facts, it isn’t always the best determiner for learning. Not everyone in the populace thinks along analytical mindsets (see: Differentiation and Multiple Intelligences). Learning is experiential; based on a combination of observation, socialization and the connections we make between ourselves and the world around us. These elements cannot often be neatly charted or mapped out. The work of artists like Singer and Graves, eloquently express how a painting can be worth ‘a thousand words,’ or in the case of the Environmental Graphiti series, sets of raw climate data.

Love your writing! The work on the surface and I am sure in person very different, has a psychedelic feel. Interesting way and important message. The one with the worded resonates most for me. A good read Adam. Let’s look at penciling a studio visit. Have a great weekend Arlene
Arlene http://www.arlenerush.com
>
LikeLike
You have an important voice! Combining contemporary art with art education is very important! Thanks
LikeLike